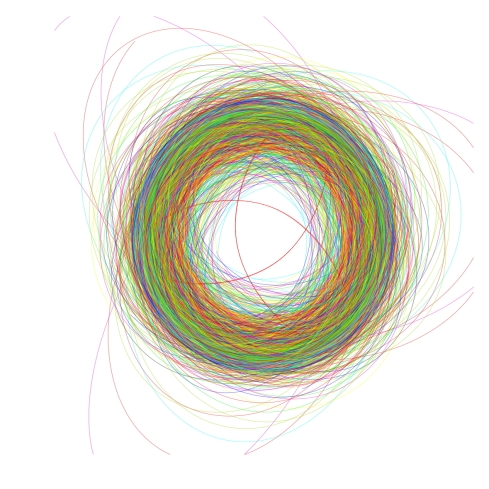
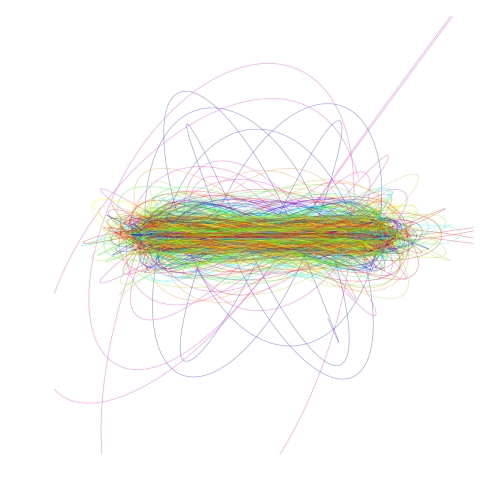
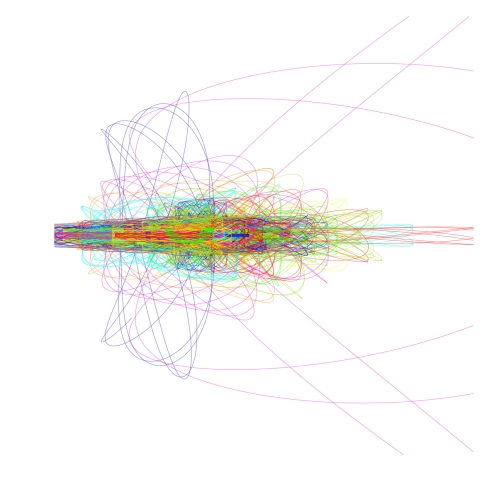
A little astro art for today: as part of my analysis of stellar orbits of ultracool subdwarfs (presented at the 214th American Astronomical Society meeting in Pasadena, CA), I decided to try computing and visualizing the orbits of nearly 500 L-type dwarfs from the Sloan Digital Sky Survey (SDSS) based on kinematic data produced by Sarah Schmidt – you know, just for fun.

The orbits were generated by assuming that the gravitational potential of our Galaxy can be described by smooth, azimuthally symmetric functions (so-called “Plummer spheres“) that describe the thin disk, thick disk, halo and bulge populations of our Galaxy (see this link for good technical discussion of such models).  I then use a simple numerical integrator (Runge-Kutta model) and the initial position and velocity vectors from Sarah’s work, to pre- and post-dict the orbits of these stars 500 million years into the past and future.

Each individual orbit is really a rough estimate of the star’s true path; uncertainties in the current distance and motion of the star, and the simplistic model used for the Galaxy, means that errors can creep up within a single Galactic orbit (about 200 million years for the Sun).  However, a statistical picture of the entire population can be realized from this exercise.  Stars are born from massive molecular clouds that typically have circular orbits in the plane of the Galactic disk.  As stellar populations age, random encounters and secular disturbances can “puff” up their orbits to higher eccentricities and inclinations.  This is visually apparent in an orbital plot.

sch_xy

This first figure shows the orbits as viewed from above. Note that the bulk of the stars fill an annulus, the outer edge of which is near the radius of the Sun’s Galactic orbit (our local neighborhood).  Most of the stars in our area are coming from regions interior to this radius, rather than from the outer Galaxy, although a few L dwarfs do have pretty wide orbits (some off the projected area). At least one L dwarf gets within 1 kpc (3000 light years) of the center of the Galaxy.

sch_xz

This next image shows the same orbits, but now seen from the side along the edge of the Galactic plane.  Again, we see that most of the orbits are bunched up into a band about 200 pc (600 light-years) in thickness – this is the “thin disk”.  There is a loose skin of more inclined orbits that looks like a “thick” disk, and then a few L dwarfs that have crazy inclined orbits taking them thousands of light-years above or below the Galactic plane.  A being standing on a planet around one of these stars 100 million years ago would have had a tremendous view of the Milky Way Galaxy!

sch_rz

This last image is my favorite, showing the same orbits but in a cylindrical projection: radial distance from the center of the Galaxy (at left) versus vertical distance below or above the plane.  Families of orbits become quickly evident, occupying “boxes” in this diagram, the result of the symmetry of the gravitational potential used.  The outer borders are defined by the total mechanical energy of the star, which is primarily set by the star’s local speed; the inner borders are defined by the angular momentum of the star.  Thus, these two parameters – energy and angular momentum – are the two most important when working with symmetric potentials.  These are the two quantities that best define planetary orbits around the Sun.

I found this to be a beautiful way of visualizing a fairly complex dataset, while illustrating the underlying orbital physics (as well as the assumptions made in the calculation).  It’s also just beautiful, appearing as a dragonfly with meaty body and gossamer wings, a remarkably synergy between biological and astronomical systems.

This image was awarded 2nd prize in the 2011 Art in Science competition conducted by the UCSD Library (some of the other winners can be seen here).  Who knew celestial mechanics can be both interesting and pleasing!

Our office view

We are enjoying Day 1 of my research group’s semi-annual writing retreat, this year at the visually inspiring Wildflower house at the Sundance Resort.  Besides finally getting all the papers done we have been meaning to do all year, the retreat also gives us an opportunity to do some group professional development with an outside expert.

This evening, that expert was my spouse and science journalist Genevive Bjorn, who led us through a discussion of the Nature article “Initial sequencing and analysis of the human genome” (Lander et al., 2001, Nature, 409, 860-921).  This is the famous “first human genome” paper produced as part of the Human Genome Project.  As a group of astronomers dissecting the 62-page foundational article of the field of genomics, we experienced the frequent perspective of scientists outside our field trying to understand our work.

Read the rest of this entry »

Last month we celebrated the first birthday of the daughter of one our dear friends on Maui, Anuhea.  The first birthday is a cause for celebration in traditional Hawaiian culture, accompanied by an ahaaina palala which has evolved into the modern day “baby luau“.  Part of the palala includes gifts (pule), chants (mele) and dances (hula) by friends and family to express their aloha for the child (see The Polynesian Family System in Ka u, Hawaii by ES Craighill Handy & Mary Kawena Pukui).

As our pule to Anuhea, my wife and I composed the following “name chant”, or mele inoa.  It was modeled from the mele inoa written for Barack Obama, “Hiki Maila Ke Ali‘i Ho‘oulu” by (Kumu Hula) Manu Ikaika.  The child’s first name, Anuhea, means cool, gentle rain, so part of our mele refers to her as the gentle rain that nourishes our hearts and outlasts even the strongest storms.  Her second name, Pomaikai, means wisdom, good fortune and prosperity, which we of course wish for her in her life ahead.

If anyone could help translate this completely (and properly!) into Hawaiian, we’d be very grateful!

Kaikamahine o Maui (Daughter of Maui)

Look at our daughter, gentle and soothing
A child who brings joy to all around her

A gentle rain that nourishes the land
And helps the seed of love spread in our hearts

Her voice is a sweet melody that lifts the spirit
Her strength is her gentle way

Oh child of the land
Allow the goodness in your heart to flourish

Take courage even as the tempests come
Knowing they too return to the gentle rain

May you grow to be a wise, joyful and creative woman
Infused with the love of your ohana

E ola mai
Ka pono o ke ao
E aloha e
He inoa no Anuhea Po
maikai Fortune

Early this month, we had our first commissioning run of the Folded Port Infrared Echellette, or FIRE, a near-infrared spectrograph designed for the Magellan Telescopes.  After a two-week installation period in late February/early March led by the instrument PI Rob Simcoe, FIRE team members John Bochanski and Matt Smith from MIT and Craig McMurtry from U. Rochester, and Magellan engineers (I missed all the action, teaching 250 students Physics 1), FIRE was ready to view the sky for a week-long commissioning run starting March 28th.

Early results have been spectacular.  A few of the image frames from the first week are shown below.  The high quantum efficiency and low readnoise of the Teledyne Hawaii 2RG detectors, and the excellent image quality of the Baade Telescope, has resulted in higher sensitivity than originally planned.   In the echelle mode, Rob has estimated roughly 20-25% efficiency, including telescope and slit losses, and a nearly-flat zero point of 16-17 AB magnitudes (1 count/sec/pixel) across the 0.85-2.4 micron range.  In plain language, this means we can observe very faint sources – such as a the coldest brown dwarfs and highest redshift quasars – with the echelle mode’s moderate resolution (λ/Δλ ≈ 6000).  The prism-dispersed mode has also proven very sensitive, and we’ve been able to follow-up several J ≈ 19-20 cold brown dwarf candidates from WISE with relative ease.  Look for first science results in the literature soon!

Read the rest of this entry »

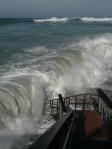
The roughly twice-daily ocean tides ebb and flow on different timescales and to different heights depending on the relative orientations of the Sun and Moon.  It is the gravitational pull of these the two bodies that are responsible for our tides, a fact first explained by Isaac Newton.  When the Moon is full (and again when it is new), it, the Earth and the Sun are nearly aligned – a situation know as syzygy (one of my favorite words). In this orientation, the tidals forces combine to amplify the tidal surge; we have a spring tide.  Throw in some big surf and an unusually close Moon, and you’ve got quite a shorebreak.

Read the rest of this entry »

Enter your email address to subscribe to this blog and receive notifications of new posts by email.

Join 11 other subscribers

Archives

Blog Stats

  • 154,403 hits